Wire-Mesh Sensor
Wire-mesh sensors belong to flow imaging techniques and allow the investigation of multiphase flows with high spatial and temporal resolution. The wire-mesh sensor principle is based on a matrix-like arrangement of the measuring points. Two set of wire electrodes are stretched along a vessel or pipe having a small axial separation between them and being perpendicular to each other. This way, a mesh or a grid of electrodes is formed in the cross-section.
The transmitter electrodes are sequentially activated while all receiver electrodes are parallel sampled, in such a way, that an electrical property (conductivity or permittivity) of the fluid in each crossing point is evaluated. Based on those measurements the sensor is thus able to determine instantaneous fluid distribution across the cross-section, for instance, of a pipe. The following pictures show the three-dimensional representation of a slug flow and the results of the visualization of different flow regimes of a air-water vertical flow
Investigation in Multiphase Flow
Multiphase are present in a range of industrial applications, among them in food, nuclear, aerospace, geothermal and petroleum industry, just cite a few. In industrial applications, two-phase flow is moreover typically constrained to pipes or vessels. In many applications, such flows determine safety and efficiency of the processes and plants. Therefore, measurement and imaging of two-phase flows has received much attention in recent years. On the one hand online flow monitoring is required in many applications, on the other hand detailed information about flow behavior under controlled conditions are essential for flow modeling and prediction. The validation of flow models and predictions require small and medium scale two-phase flow experiments with accurate, multi-dimensional and non- or minimal intrusive measurement techniques for different physical parameters, such as phase fraction distributions.
The data obtained from the mesh sensor is a three-dimensional matrix with values proportional to the gas volume fraction at the pipe. This is obtained after a normalization of values, where two reference measurements are required: pipe full with water (matrix VH is obtained) and an empty pipe (matrix VL). Fig.1 illustrates the matrix. A physically void fraction can assume values between 0 and 100% but the matrix is saved in computer memory 8-bit format.
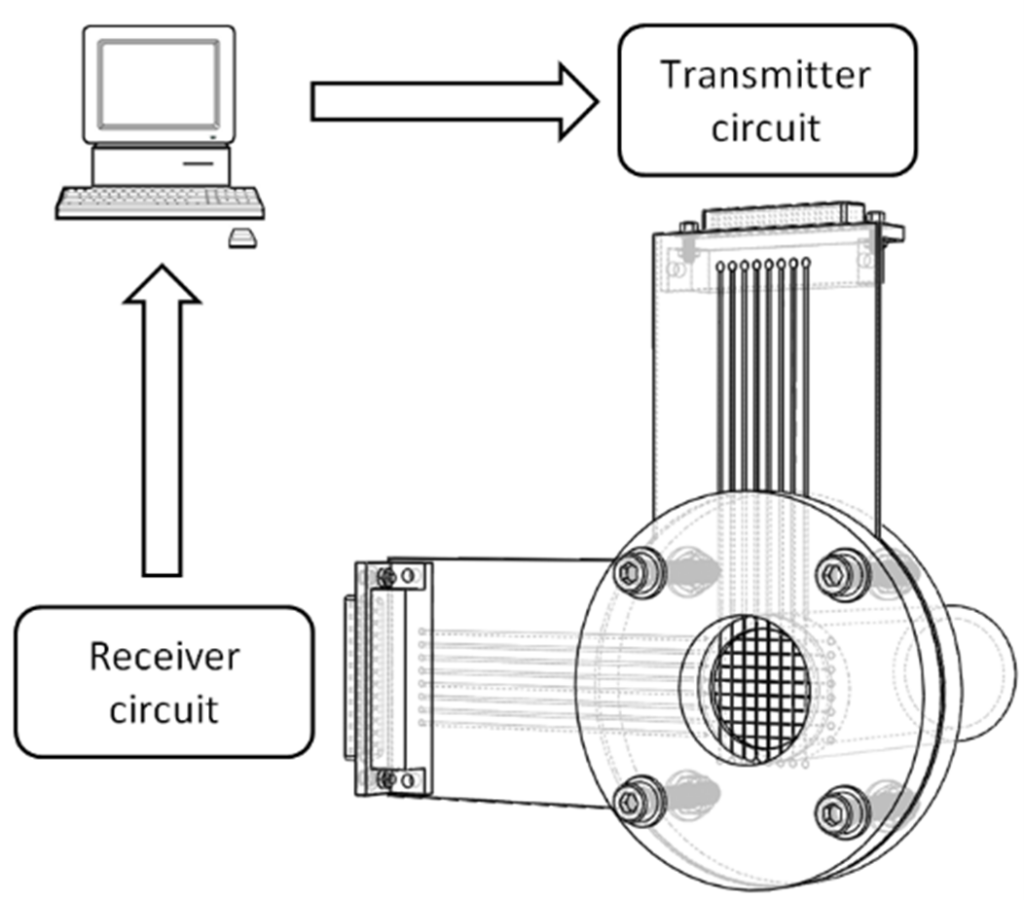 | 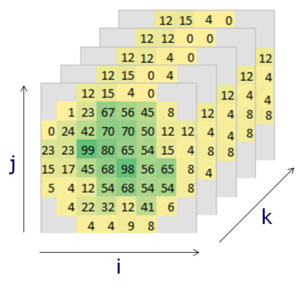 |
Figure 1. The wire-mesh data matrix.
From the 3D-matrix cross-sectional images as well as axial slice images (axial chord along the pipe) can be generated which is an important aid for flow visualization. Fig. 3 depicts a typical image of a gas bubble flowing in a horizontal pipe. Blue color represents water and red color the bubble
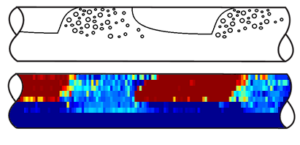
Figure 2. Representation of aerated slug flow measured by the wire-mesh sensor in an exemplary flow, the liquid flow rate is 3822,68 l/h, the gas flow rate is 3822,68 l/h
Selected Case Studies at NUEM
NUEM has applied wire-mesh sensors in several applications, such as horizontal and vertical flow lines involving gas liquid, and solid phases.
Horizontal Gas-Liquid Flow
Flows involving the simultaneous transport of gas and liquid in pipes are present in many industrial applications, among them in the food, nuclear, aerospace, geothermal, and petroleum industry, just to cite a few. In the last decades, an intense effort has been devoted to the study and modeling of the flow characteristics in order to increase safety and profit margins in pipeline operations. An important characteristic of two-phase flows is the existence of a variety of flow regimes, depending, among other variables, on the flow rates of each phase.
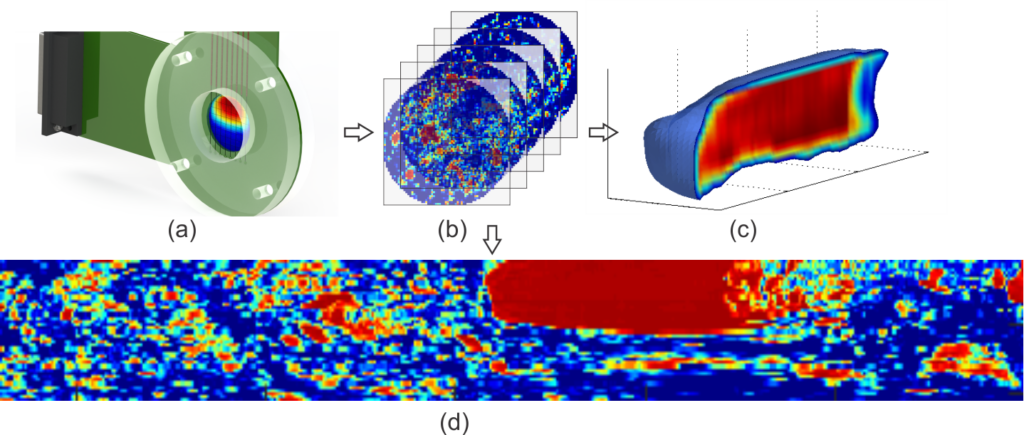
Fig. 1 – (a) Wire-mesh sensor cross-section measuring representation. (b) Measured frames stacked in the timeline. (c) 3D bubble surface reconstruction. (d) Central chord of the flow from cross-sectional images
Vertical Downward Annular Flow
The annular two-phase flow is characterized by a continuous, fast-moving gas core laden with droplets and a liquid film wetting the pipe wall. This flow pattern is often observed in pieces of industrial equipment such as nuclear reactor systems, evaporators, condensers, and the oil and gas industry, notably in gas wells with condensate.
The gas-liquid interface of the annular flow is irregular because of the presence of waves, structures named in the literature as disturbance waves, and ripples. The remaining portion of the liquid film is identified as substrate or base film. The waves are formed due to the action of inertia, the gravitational force, and the gas shearing on the interface. Moreover, the gas-liquid interface in vertical downward annular flow (VDAF) is circumferentially non-uniform regarding wave activity. The shape of the interface would depend on the phase flow rates and, in some works, it was associated with the roughness in single-phase turbulent pipe flows to determine the interfacial shear stress. Furthermore, it has been observed that the disturbance waves caused liquid entrainment into the core flow because of the interaction between the liquid and the gas phases. The liquid entrainment affects the interfacial shear friction that influences the pressure drop and the two-phase transfer of momentum, mass, and heat. In addition, the disturbance waves are inertia-dominated structures that travel along with the liquid film at more significant velocities than those of the substrate, and ripples can be observed on the surface of the disturbance waves. The aim of this study is to provide an experimental characterization of the liquid film to complement the information in the literature, optimize models and contribute to the enhancement of the monitoring processes that guarantee flow assurance in the oil and gas industry.
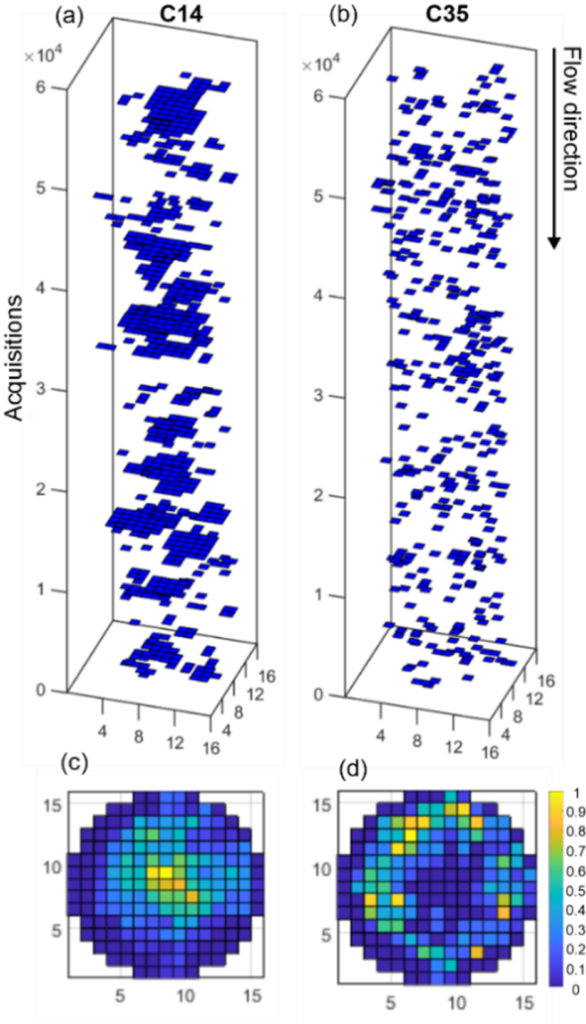
Fig. 1 – (a)-(b) Droplets identified in the gas core. (c)-(d) Distribution of the droplets identified in the cross-sectional of the pipe
Three-phase gas-oil-water flow
Three-phase gas-oil-water flow is a common occurrence in the petroleum industry. This type of flow has yet not received much attention in experimental investigation. One of the reasons for this is the lack of appropriate techniques for the accurate measurement of three-phase gas-liquid-liquid flows. A potential technique for the accurate experimental investigation of three-phase flows is the developed dual-modality wire-mesh sensor.
In the dual-modality version, two frequencies may be selected for determining the unknown electrical components and applying data fusion models to evaluate the phase fraction distribution.
An experiment was performed to validate the data fusion method and the electronics. The pipe segment with the stratified mixture was shaken to mimic a pipe flow. After agitation, the pipe segment with the sensor was put at rest. A further intentional agitation was done in order to remove oil droplets trapped in the wires, during the emulsion breakup process (indicated by a yellow arrow). The agitation and the following separation process were monitored by the wire-mesh sensor and in parallel with the conventional photo camera. Fig. 1 depicts axial slice images which were produced by taking the values from electrode number 4, i.e. along a central chord of the pipe. Fig. 1a and 1b show measured permittivity and conductivity, respectively, while Fig. 1c shows the obtained fused image for the phase fractions. Here the applied threshold value to define the continuous phase was also 10 uS/cm. Fig. 1 also shows three snapshot photos of the process. Due to the agitation, the stratified structure at the beginning is well mixed, as can be observed in the period up to approximately 8 s. Then the separation process takes place as the sensor is put at rest. Due to the large density difference, gas separates very rapidly from the liquid. The agitation causes oil and water to form an emulsion as shown by the picture at 10s. The emulsion formation is also well observed by the wire-mesh data. Fused data presents some intermediate color, as expected. At the end of 30 s, almost all emulsion was broken and the initial stratified structure is again achieved.
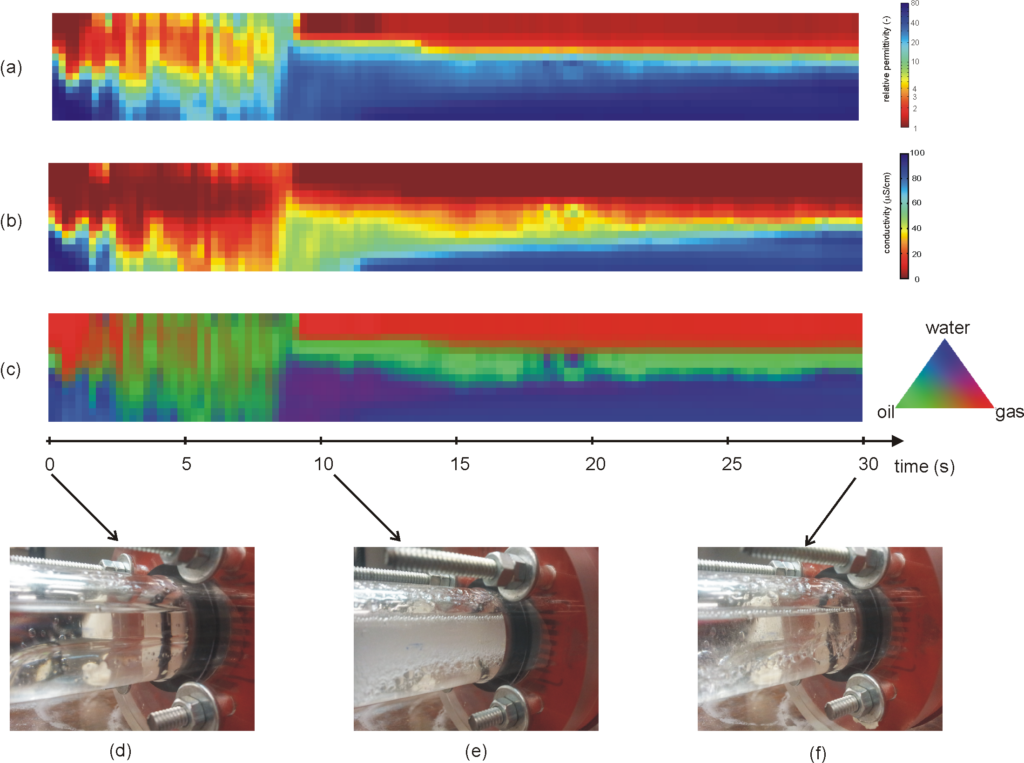
Fig 1 – Axial slice images of flow experiment: (a) permittivity distribution, (b) conductivity distribution, and (c) fused image of phase distribution. At the bottom, three snapshot photos of initial (d), intermediate (e), and final (f) conditions. The yellow arrow in (c) indicates an intentional slight agitation of the pipe segment to remove oil droplets trapped in the wires
In order to obtain quantitative insights into the process, the cross-sectionally averaged phase fractions are plotted over time in Fig. 2. As a quality check of the method proposed here, the sum of all phases is also displayed, which ideally should always be equal to unity. The value of sum is slightly higher than unity (average value over time is 1.03) but still very close to the ideal value. The final values of phase fractions are very close to the initial values, as expected. It was also expected that after the agitation, the phase fraction values would have maintained constant. The fluctuations in phase fraction values are due to the fact that some oil droplets got trapped in the wires and once broken, they alter the measured phase fraction value. The intentional agitation (indicated by the arrow) also caused the values to change. Although there are these small discrepancies that will be verified in future work, this preliminary study shows promising results for the investigation of three-phase flows.
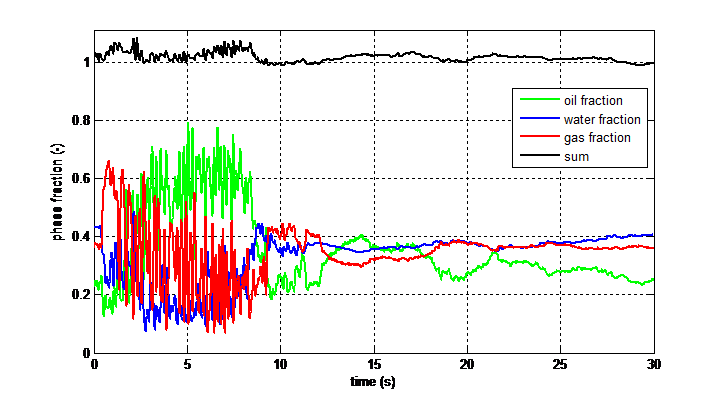
Fig 2 – Time series of phase fraction for the flow experiment.
Slurry Flow
Multiphase reactors are widely used in various industrial processes and can be found as gas-liquid, gas-solid, liquid-solid, or gas-liquid-solid mixtures. Flow visualization and characterization of multiphase mixtures have been the the focus of many studies aiming to understand the fundamental hydrodynamic and transport process in some applications.
In this case study, we report on the application of a wire-mesh sensor to image solid concentration in liquid-solid mixtures. Dense liquid–solid mixtures for different solid concentrations were monitored in a stirred tank of 100 mm diameter with a capacitance wire-mesh sensor. The electronics employed were operated at 1000 frames per second repetition rate and the sensor applied (16 x 16 wires) has a spatial resolution of 6.25 mm. Volume concentration in the range of 10 % to 30% of silica sand particles (diameter ~ 105 µm) was stirred with water to form slurries.
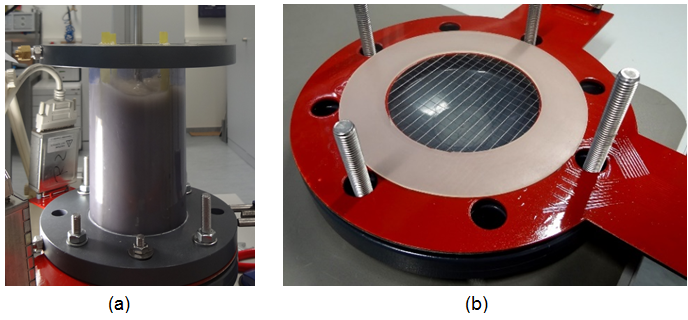
Fig 1. (a) Experimental apparatus for visualization of hold-up distributions in slurries (b) Wire-mesh sensor 16 x 16 100 mm i.d displaced near the bottom of the PVC tank.
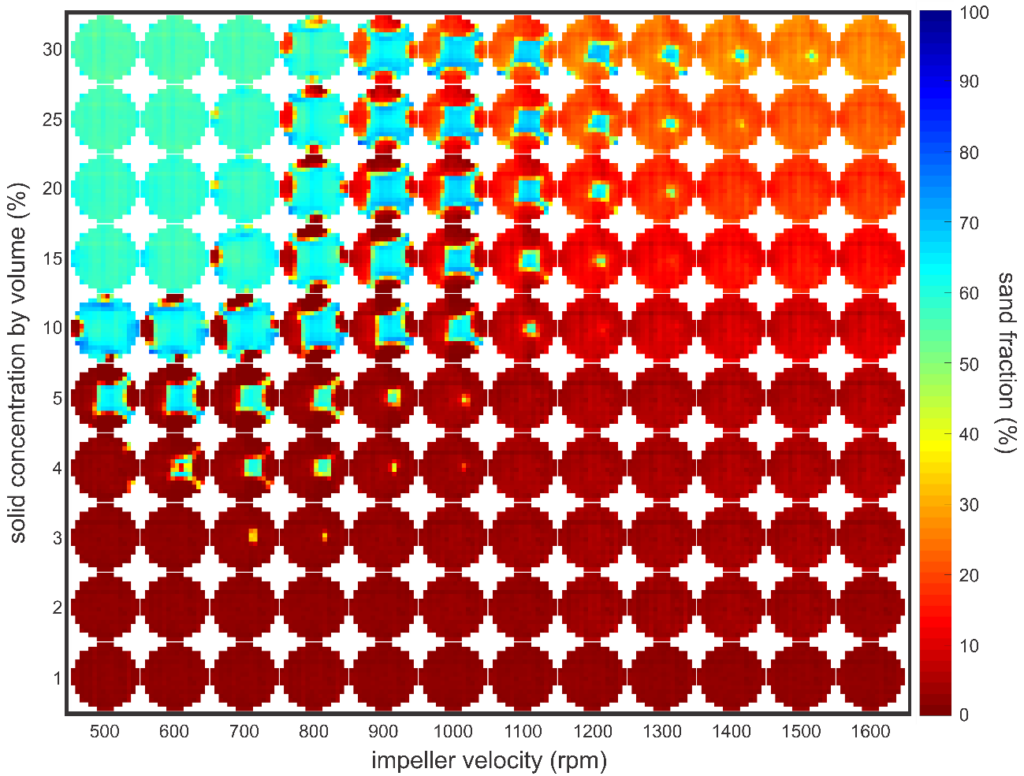
Fig. 2 – Cross-section images showing the distribution of solid calculated by the empirical approach.